An interesting chart popped recently popped up in the Facebook Ouraring-Users group. The graph provided by Chuck Hazzard (an Oura Ring employee) was generated using HeadsUpHealth Service. Chuck used RHR data (Resting Heart Rate) from his Oura Ring and compared it with insulin load levels from MyFitnessPal food logging. The results show how our RHR (which translates into readiness) can be influenced by carbs and protein.
In a world with year-round plentiful sugars biohackers tend to get hung up on counting carbohydrates. It is important to remember that while protein is essential it can be easily converted to sugars. Our liver is more than happy to take up to 56% of the protein we eat and convert it over to glucose. There is a simple equation we can use to calculate our “insulin load”:
Insulin Load = Carbohydrates (g) – Fiber (g) + [.56 x Protein (g)]
The above formula suggests that if we limit carbs and protein and boost fiber we could reduce our insulin load. This provides an entirely different way of looking at meals. Someone on a low carb diet might consider three eggs to be less likely to cause an insulin response than a serving of almond butter with macadamia nuts.
Let’s compare the two:
3 Hard Boiled Eggs (150g)
NetCarbs = 2.8g
Protein = 17.7g
Insulin Load = 2.8g + [.56 * 17.7]
Insulin Load = 12.7
Almond Butter (2 Tbl) + Macadamia Nuts (1oz)
NetCarbs = 4.1g
Protein = 8.8g
Insulin Load = 4.1g + [ .56 * 8.8 ]
Insulin Load = 9
As you can see the insulin load is reduced by 30% for the almond butter and macadamia nuts option. Keep in mind that all of these are low carb friendly foods in moderation.
If one were to log their daily intake of foods and have a breakdown of carbs, fiber and protein we could easily calculate the insulin low, average and maximum levels for that person. Popular food logging apps like
cronometer and
MyFitnessPal are excellent tools for logging, breaking down meals into carb and protein content then exporting this data into CSV files for further scrutiny. This data is based on two months of dietary data from cronometer. I imported the CSVs into a google sheet and ran the above insulin load equation for each day and came out with these averages:
| Avg Insulin Load: |
97.40 |
| Avg Net Carbs: |
42.09 |
The Peaks and troughs fit nicely around the averages.
| Low Net Carbs: |
17.67 |
| High Net Carbs: |
69.53 |
|
|
| Min Insulin Load: |
46.21 |
| Max Insulin Load: |
145.56 |
Comparing Insulin Load with Biometrics
The insulin load formula has the potential to help us optimize our wellbeing. Using more #quantifiedself collected data we can look for the following metrics compared to insulin load. These charts were produced from data exported through cronometer and graphed with google sheets.
- deep sleep
- REM sleep
- recovery (HRV)
- recovery (RHR)
- blood glucose
- blood ketones
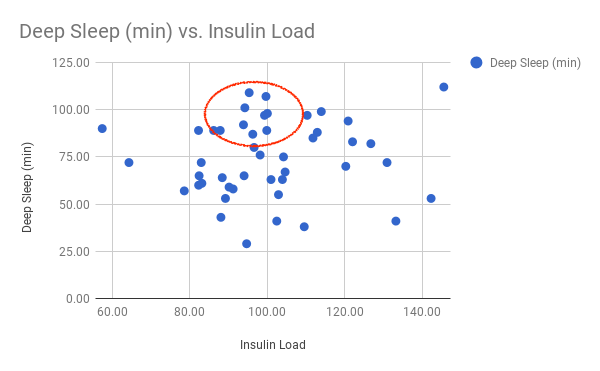
I’ve generated a few scatter plots below suggesting that there are “sweet spots” to hold our insulin load out for better health. These data provided is specific to me and could well be significantly different for others.
- Deep Sleep vs Insulin Load – optimal IL range – [ 95 – 100 ]
-
- REM Sleep vs. Insulin Load – More REM is better – optimal IL range [ 90 – 120 ]

- HRV vs Insulin Load – A Higher Heart Rate Variability is a sign of recovery – optimal IL range [ 80 – 120 ]

- Resting Heart Rate (RHR) vs Insulin Load – A lower resting heart rate is better – optimal IL range [ 80 – 110 ]

- Blood Glucose vs. Insulin Load – A lower blood glucose levels is better – optimal IL range [ 75 – 115 ]

- Blood Ketone vs. Insulin Load – A higher ketone reading is better – optimal IL range [ 75 – 115 ]