As your write advanced MicroPython programs you might run into trouble with memory usage. For example trying to import a large module and receiving a memory allocation error means that your program is using too much of the board’s RAM and can’t load more code into memory. How can you figure out what’s using the most memory in your MicroPython program? The micropython.mem_info function comes to the rescue! This function will print out information including the amount of RAM being used and how it’s allocated. To use the function just import the micropython module and call the global mem_info() function inside it. For example:
>>> import micropython
>>> micropython.mem_info()
stack: 2144 out of 8192
GC: total: 36288, used: 13760, free: 22528
 No. of 1-blocks: 113, 2-blocks: 40, max blk sz: 263, max free sz: 1236
Memory usage is shown on the GC: line and includes the total memory available to your MicroPython program (which might be less than the total memory on your processor as MicroPython uses some memory internally for an execution stack), the amount currently being used, and the amount that’s free. Let’s see what happens when you import a large module and call mem_info again:
>>> import framebuf
>>> micropython.mem_info()
stack: 2144 out of 8192
GC: total: 36288, used: 14288, free: 22000
No. of 1-blocks: 125, 2-blocks: 46, max blk sz: 263, max free sz: 1236
Notice the used memory increased a bit and the free memory decreased accordingly! Using the mem_info function you can explore what parts of your program take the most memory. Grab a snapshot of memory usage before and after calling functions, importing modules, etc. to see how the memory usage changes. Try to remove unnecessary variables, functions, etc. and check if your memory usage lowers with mem_info.
There’s one other interesting thing the mem_info function can do, it can display where and what type of Python objects are being stored in RAM. Just call the function and provide a True value for the verbose parameter to see a visual map of RAM usage:
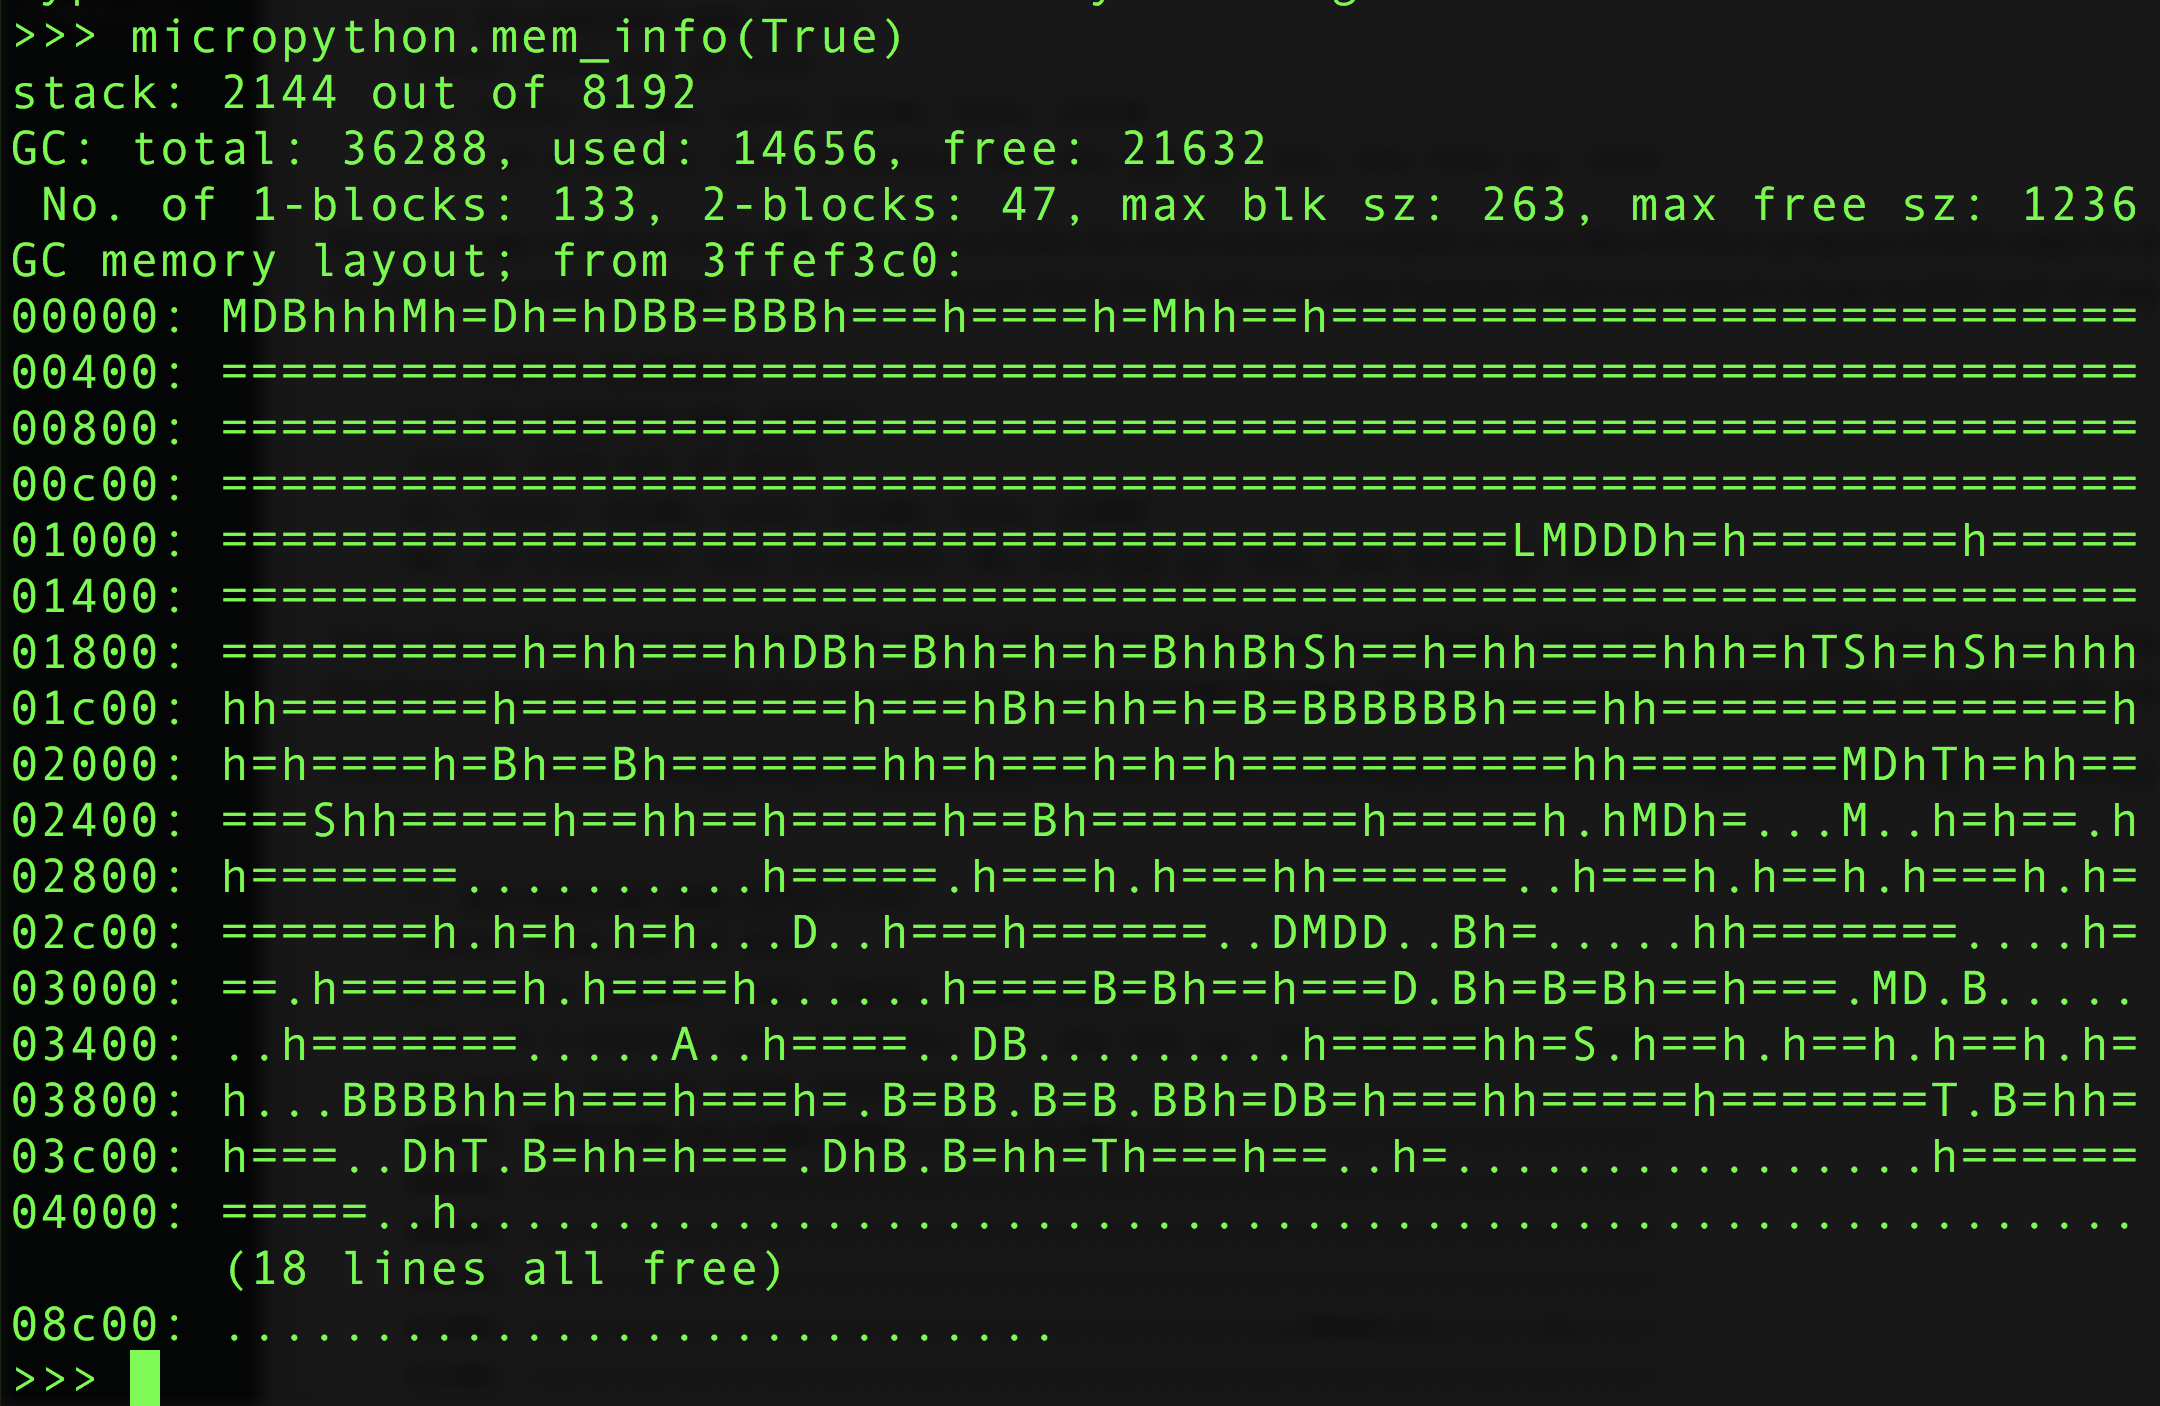
>> micropython.mem_info(True)
stack: 2144 out of 8192
GC: total: 36288, used: 14656, free: 21632
 No. of 1-blocks: 133, 2-blocks: 47, max blk sz: 263, max free sz: 1236
GC memory layout; from 3ffef3c0:
00000: MDBhhhMh=Dh=hDBB=BBBh===h====h=Mhh==h===========================
00400: ================================================================
00800: ================================================================
00c00: ================================================================
01000: ===========================================LMDDDh=h=======h=====
01400: ================================================================
01800: ==========h=hh===hhDBh=Bhh=h=h=BhhBhSh==h=hh====hhh=hTSh=hSh=hhh
01c00: hh=======h===========h===hBh=hh=h=B=BBBBBBh===hh===============h
02000: h=h====h=Bh==Bh=======hh=h===h=h=h===========hh=======MDhTh=hh==
02400: ===Shh=====h==hh==h=====h==Bh=========h=====h.hMDh=...M..h=h==.h
02800: h=======..........h=====.h===h.h===hh======..h===h.h==h.h===h.h=
02c00: =======h.h=h.h=h...D..h===h======..DMDD..Bh=.....hh=======....h=
03000: ==.h======h.h====h......h====B=Bh==h===D.Bh=B=Bh==h===.MD.B.....
03400: ..h=======.....A..h====..DB.........h=====hh=S.h==h.h==h.h==h.h=
03800: h...BBBBhh=h===h===h=.B=BB.B=B.BBh=DB=h===hh=====h=======T.B=hh=
03c00: h===..DhT.B=hh=h===.DhB.B=hh=Th===h==..h=................h======
04000: =====..h........................................................
 (18 lines all free)
08c00: ............................
Wow, there’s a lot going on in that output! What you’re seeing is a visual representation of the total RAM available to MicroPython on the board. Memory that’s free is marked with a dot/period and memory that’s being used is marked with a character. You have to look at the MicroPython source to see all the possible character types, but here’s a quick list of interesting ones:
- T = tuple
- L = list
- D = dictionary
- S = string
- A = array or bytearray
- F = float
- B = function
- M = module
- h = some other value, like an integer or python object
You can’t tell where a specific Python object or value is being stored, but this view might be handy for more in depth debugging like monitoring memory fragmentation.
In other news CircuitPython had a new 0.9.3 release this week! The release includes support for OneWire temperature sensors and a few small board definition updates. Grab the latest release from the releases tab on GitHub and load it on a board to try it!